Imagine you’re a new trader entering the exciting world of cryptocurrency. Eager to make smart investment decisions, you find yourself in need of guidance when it comes to reading and analyzing trading charts. Well, fear not! This article is here to provide you with a beginner-friendly analysis of crypto trading charts. Whether you’re new to trading or just looking to brush up on your skills, this guide will equip you with the knowledge you need to confidently navigate the complex world of cryptocurrency trading. So, grab your notebook and get ready to dive into the world of crypto trading chart analysis!
Understanding Crypto Trading
What is Crypto Trading?
Crypto trading refers to the buying and selling of cryptocurrencies, such as Bitcoin, Ethereum, and Litecoin, with the aim of making a profit. Unlike traditional financial markets, crypto trading operates in a decentralized manner, with transactions taking place directly between buyers and sellers on various cryptocurrency exchanges.
Types of Crypto Trading
There are different types of crypto trading strategies that traders employ to capitalize on price movements in the cryptocurrency market:
-
Day Trading: Day traders execute multiple trades within a single day, taking advantage of short-term price fluctuations.
-
Swing Trading: Swing traders aim to capture medium-term trends and hold positions for a few days to several weeks.
-
Scalping: Scalpers target small, quick profits by executing numerous trades within a very short period, relying on technical analysis indicators.
-
Position Trading: Position traders adopt a longer-term approach, holding positions for weeks, months, or even years, based on their analysis of the long-term market trends.
Importance of Chart Analysis in Crypto Trading
Chart analysis is a crucial aspect of crypto trading as it helps traders make informed decisions by studying and interpreting price patterns, trends, and various indicators present on trading charts. By analyzing historical and current price data, traders can identify potential entry and exit points, predict market movements, and manage risk more effectively. Chart analysis forms the foundation of technical analysis, which plays a key role in crypto trading strategies.
Basics of Chart Analysis
Candlestick Charts
Candlestick charts are commonly used in crypto trading as they provide important information about price action within a specific time period. Each candlestick represents a specific time frame, such as one minute, one hour, or one day. The body of the candlestick indicates the opening and closing prices, while the wicks (or shadows) represent the high and low prices during that time period. Traders analyze the patterns formed by candlesticks to identify potential trend reversals or continuation.
Support and Resistance Levels
Support and resistance levels are key psychological levels on a price chart where buying or selling pressure tends to occur. Support refers to a price level where buying pressure exceeds selling pressure, causing the price to bounce back up. Resistance, on the other hand, is a price level where selling pressure exceeds buying pressure, causing the price to reverse downward. Identifying these levels helps traders anticipate potential price movements and make informed trading decisions.
Trends and Trendlines
Trend analysis is an essential part of chart analysis. Traders use trendlines to identify the direction of the price movement and potential areas of support or resistance. An uptrend is defined by higher highs and higher lows, while a downtrend consists of lower highs and lower lows. Drawing trendlines allows traders to visualize the overall trend and make trading decisions accordingly. It is important to note that trends can change, and traders must be mindful of trend reversals.

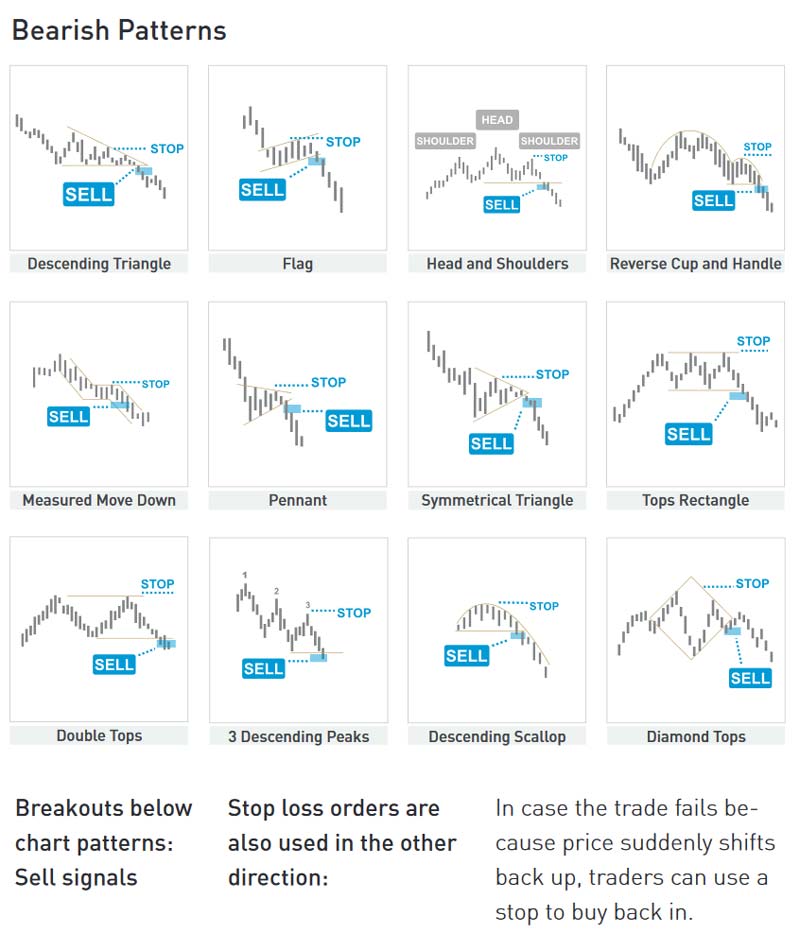
Popular Chart Patterns for Crypto Trading
Head and Shoulders
The head and shoulders pattern is a reversal pattern that signals the end of an uptrend and the potential for a downward price movement. It consists of three peaks, with the middle peak being the highest (the head), and the other two peaks (the shoulders) being of similar height. Traders look for a break below the neckline, which acts as a confirmation of the pattern, before considering a short trade.
Double Tops and Double Bottoms
Double tops and double bottoms are also reversal patterns that indicate a potential trend reversal. A double top occurs when the price reaches a certain level twice and fails to break higher, signaling a potential downward move. Conversely, a double bottom occurs when the price reaches a certain level twice and fails to break lower, suggesting a potential upward move. These patterns are often used by traders to enter or exit positions.
Triangles
Triangles are chart patterns that form when the price consolidates between two converging trendlines. There are three types of triangles: ascending, descending, and symmetrical. Ascending triangles indicate a potential upward breakout, descending triangles suggest a potential downward breakout, and symmetrical triangles do not provide a definitive direction. Traders look for a breakout above or below the triangle’s trendlines before considering a trade.
Cup and Handle
The cup and handle pattern is a bullish continuation pattern that resembles a cup with a handle. The cup represents a temporary market reversal, while the handle represents a consolidation period before the price continues its upward movement. Traders often look for a breakout above the handle’s resistance level as a confirmation of the pattern before considering a long trade.
Flags and Pennants
Flags and pennants are short-term continuation patterns that occur after a strong price movement. Flags are rectangular patterns that form when the price consolidates in a narrow range, while pennants are triangular patterns with converging trendlines. Both patterns indicate a temporary pause in the price action before it continues in the same direction. Traders look for a breakout above or below the flag or pennant as a signal to enter or exit a trade.
Indicators for Crypto Trading Chart Analysis
Moving Averages
Moving averages are indicators that smooth out price data and provide a visual representation of the average price over a specified period. They help traders identify trends, support and resistance levels, and potential entry and exit points. Common types of moving averages include the simple moving average (SMA) and the exponential moving average (EMA).
Relative Strength Index (RSI)
The Relative Strength Index (RSI) is a momentum oscillator that measures the speed and change of price movements. It ranges from 0 to 100 and is used to identify overbought and oversold conditions. Traders use the RSI to determine potential trend reversals and generate buy or sell signals.
MACD (Moving Average Convergence Divergence)
The Moving Average Convergence Divergence (MACD) is a trend-following momentum indicator that shows the relationship between two moving averages of a security’s price. It consists of a MACD line, a signal line, and a histogram. Traders use the MACD to identify potential buy and sell signals, as well as divergence between the MACD and the price.
Bollinger Bands
Bollinger Bands consist of a middle band (usually a simple moving average) and two outer bands that represent the standard deviations of the price from the middle band. They are used to measure volatility and identify overbought and oversold conditions. Traders look for price reversals when the price reaches the outer bands or for periods of low volatility when the bands squeeze together.
Fibonacci Retracement Levels
Fibonacci retracement levels are horizontal lines that indicate potential support or resistance levels based on the Fibonacci sequence. Traders use these levels to identify potential price reversals or areas of interest for entering or exiting trades. Common retracement levels include 23.6%, 38.2%, 50%, 61.8%, and 78.6%.

Using Chart Analysis to Identify Entry and Exit Points
Identifying Support and Resistance Levels
Support and resistance levels play a crucial role in determining entry and exit points. Traders look for areas where the price has previously reversed or stalled, indicating the presence of support or resistance. By buying near support and selling near resistance, traders aim to maximize their profits and minimize their losses.
Recognizing Trend Reversals
Chart analysis helps traders identify potential trend reversals, which can be profitable trading opportunities. By studying price patterns, candlestick formations, and technical indicators, traders can spot signs of a weakening trend or an emerging trend reversal. This allows them to enter or exit trades at the right time, increasing the likelihood of making profitable trades.
Utilizing Indicators for Timing
Technical indicators can be powerful tools for timing trades. Traders use indicators such as moving averages, RSI, MACD, Bollinger Bands, and Fibonacci retracement levels to generate buy or sell signals. By combining multiple indicators and analyzing their signals, traders can make more informed decisions about when to enter or exit trades.
Setting Stop Loss and Take Profit Levels
Using chart analysis, traders can determine appropriate stop loss and take profit levels to manage their risk and lock in profits. Stop loss orders are placed below support levels or above resistance levels to limit potential losses. Take profit orders are placed at predetermined profit targets or based on indicators to secure anticipated profits. By setting and adjusting these levels based on market conditions, traders can protect their capital and maximize their returns.
Applying Risk Management in Crypto Trading
Determining Risk-Reward Ratio
Risk management is a fundamental aspect of successful trading. Traders must carefully assess the potential risks and rewards of each trade before entering into a position. The risk-reward ratio measures the potential profit compared to the potential loss. By aiming for a favorable risk-reward ratio (e.g., at least 1:2), traders ensure that their potential profits outweigh their potential losses.
Position Sizing and Lot Calculation
Position sizing refers to determining the appropriate amount of capital to risk on each trade. Traders should carefully calculate their position size based on their account balance, risk tolerance, and the distance to their stop loss level. Using lot sizes, traders can control the amount of risk they are willing to take on each trade and avoid exposing their entire account to a single position.
Setting Realistic Profit Targets
Setting realistic profit targets is an essential part of risk management. Traders should identify potential profit targets based on chart analysis, market conditions, and their risk-reward ratio. By setting achievable profit targets, traders can avoid greed-driven decisions and ensure consistent profitability in the long run.

Psychology of Crypto Trading Chart Analysis
Controlling Emotions
Emotions play a significant role in trading and can often lead to poor decision-making. Fear, greed, and impatience can cause traders to deviate from their trading plan and make impulsive trades. It is essential to stay disciplined, manage emotions, and stick to the trading strategy outlined in the chart analysis.
Avoiding Overtrading
Overtrading is a common mistake made by traders, often driven by the fear of missing out on potential opportunities. Trading too often can result in increased transaction costs, excessive exposure to market volatility, and emotional exhaustion. It is important to wait for high-probability setups based on chart analysis and exercise patience when it comes to entering and exiting trades.
Sticking to a Trading Plan
A trading plan outlines the rules and strategies that a trader will follow. It is essential to develop a well-defined and comprehensive trading plan based on chart analysis and stick to it consistently. By following a predefined plan, traders can minimize impulsive and emotionally driven decisions, leading to more consistent and profitable trading outcomes.
Keeping a Trading Journal
Keeping a trading journal is a valuable tool for self-reflection and improvement. By documenting trades, including entry and exit points, reasons for taking the trade, and outcomes, traders can identify patterns, strengths, and weaknesses in their trading strategy. This helps traders refine their chart analysis approach, learn from past mistakes, and continuously improve their trading performance.
Common Mistakes to Avoid in Crypto Trading Chart Analysis
Ignoring Fundamental Analysis
While chart analysis is crucial in crypto trading, it is equally important to consider fundamental analysis. Fundamental factors, such as news events, economic data, and regulatory developments, can have a significant impact on cryptocurrency prices. Ignoring fundamental analysis can lead to missed opportunities or unexpected losses.
Overcomplicating Strategies
Overcomplicating trading strategies can hinder clarity and increase the likelihood of errors. It is important to keep chart analysis strategies simple and focused on key indicators and patterns. By mastering a few effective strategies, traders can build confidence and consistency in their analysis.
Chasing Price Movements
Chasing price movements is a common mistake made by novice traders. FOMO (Fear of Missing Out) can lead to hasty decisions based on short-term price spikes. It is important to base trading decisions on thorough chart analysis and wait for confirmation before entering a trade. This helps avoid entering positions at the peak of a price movement, increasing the risk of losses.
Not Adapting to Market Conditions
Market conditions can change rapidly, and it is crucial for traders to adapt their chart analysis accordingly. What works in a trending market may not be effective in a range-bound or volatile market. Traders should remain flexible, continuously monitor market conditions, and adjust their strategies as needed to maximize profitability.

Using Chart Analysis Tools and Software
Popular Charting Platforms
There are numerous charting platforms available that provide advanced tools for chart analysis. Some popular charting platforms include TradingView, Coinigy, and MetaTrader. These platforms offer various chart types, indicators, drawing tools, and customization options to enhance the analysis process.
Automated Trading Systems
Automated trading systems, also known as algorithmic or robotic trading, utilize chart analysis algorithms to execute trades automatically based on predefined rules. These systems can scan multiple charts, indicators, and patterns simultaneously, enabling traders to capitalize on potential opportunities without constant monitoring. However, it is important for traders to thoroughly test and understand the performance and risks associated with any automated trading system before using it.
Customizing Chart Settings
Chart analysis tools and software often allow traders to customize their chart settings to suit their individual preferences and trading strategies. Traders can adjust timeframes, chart types, color schemes, and add or remove indicators and drawings. By customizing the chart settings, traders can create a personalized analysis environment that enhances their decision-making process.
Continuous Learning and Improvement in Crypto Trading
Following Experienced Traders and Analysts
One of the most effective ways to improve chart analysis skills is by learning from experienced traders and analysts. Following reputable sources, reading books, joining online forums, and attending webinars or conferences can provide valuable insights and perspectives. It is important to choose trustworthy sources and engage in discussions with experienced individuals to expand knowledge and stay updated with the latest trends and techniques.
Joining Online Crypto Trading Communities
Joining online crypto trading communities can provide support, guidance, and a platform for sharing ideas and experiences with like-minded individuals. Engaging in discussions, sharing trade ideas, and receiving feedback from fellow traders can help improve chart analysis skills and learn new strategies. These communities often foster a supportive environment and present opportunities for networking and collaboration.
Staying Updated with News and Market Trends
Staying informed about news events and market trends is crucial for successful chart analysis. News events, such as government regulations, corporate announcements, or technological advancements, can significantly impact cryptocurrency prices. By staying abreast of current events and market trends, traders can incorporate fundamental analysis into their chart analysis, enabling more accurate predictions and informed trading decisions.
In conclusion, understanding crypto trading and mastering chart analysis are vital for new traders entering the cryptocurrency market. By studying and applying various chart patterns, indicators, and risk management techniques, traders can increase their chances of making profitable trades. Continuous learning, practicing, and refining chart analysis skills are essential for long-term success in the dynamic and evolving world of crypto trading.
